...
Field | Description |
Name | Underlying company name or commodity |
Open | Opening price for the day |
High | The highest trade price for the day |
Low | The lowest trade price for the day |
Close | The last traded price |
Sale Condition | A special condition associated with the trade |
Symbol | The ticker symbol |
Volume | The total number of shares or futures contracts traded for the day |
OI | The total number of futures contracts or options traded that have not yet been liquidated either by an offsetting futures transaction or by delivery |
Volatility | Implied Volatility is the estimated volatility of the underlying stock over the term of the option (only available for equity options) |
Theoretical Value | The hypothetical value of the options, calculated by the Black-Scholes Option Pricing Model (only available for equity options) |
Delta | Measures the sensitivity of an option’s theoretical value to a change in the underlying price (only available for equity options) |
Gamma | Measures the rate of change in the delta for every one point move in the underlying (only available for equity options) |
Theta | The measure of the time decay of an option, the dollar amount that an option will lose each day due to the passage of time (only available for equity options) |
Vega | Measures the sensitivity of the price of an option to changes in volatility (only available for equity options) |
Rho | The rate at which the price of an option changes relative to a change in the risk-free rate of interest (only available for equity options) |
Bid | The highest price a buyer of a security or instrument is willing to pay |
Ask | The lowest price a seller of a security or instrument is willing to offer |
Implied Volatility | The ATM average of the implied volatility of the nearest monthly contract |
IV Change | The underlying asset's change in implied volatility for the current trading session (only available for equity options) |
IV Rank | The current IV compared to the highest and lowest values over the past 1-year. If IV Rank is 100% this means the IV is at its highest level over the past 1-year, and can signify the market is overbought (only available for equity options) |
IV Percentile | The percentage of days with IV closing below the current IV value over the prior 1-year. A high IV Percentile means the current IV is at a higher level than for most of the past year. This would occur after a period of significant price movement, and a high IV Percentile can often predict a coming market reversal in price (only available for equity options) |
Put/Call Volume Ratio | The total Put/Call volume ratio for all option contracts (across all expiration dates). A high put/call ratio can signify the market is oversold as more traders are buying puts rather than calls, and a low put/call ratio can signify the market is overbought as more traders are buying calls rather than puts (only available for equity options) |
Options Volume | The total volume for all option contracts (across all expiration dates) traded during the current session (only available for equity options) |
Put/Call Open Interest Ratio | The put/call open interest ratio for all options contracts across all expiration dates (only available for equity options) |
Total OI | The total open interest for all option contracts across all expiration dates (only available for equity options) |
...
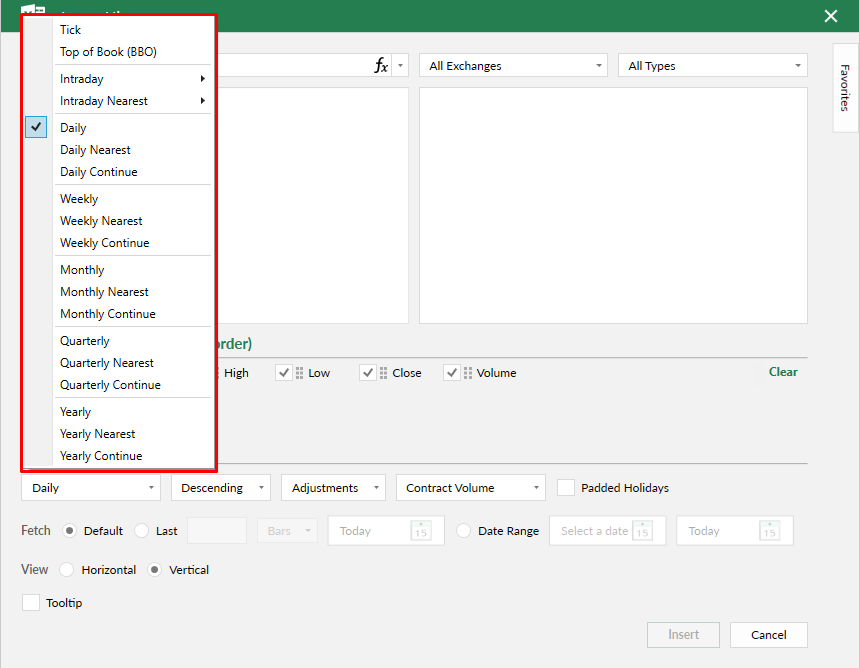
(Note: Historical Tick data is limited to the last 30 days)
Equity Sale Conditions
For ‘Tick’ and ‘Top of Book (BBO)’, below are the sale condition codes for NYSE/NYSE Arca and NASDAQ.
@ – Regular Sale
B – Average Price Trade
C – Cash Trade (Same Day Clearing)
E – Automatic Execution
F – Inter-market Sweep Order
H – Price Variation Trade
I – Odd Lot Trade
K – Rule 127 (NYSE Only) or Rule 155 (NYSE American only)
L – Sold Last (Late Reporting)
M – Market Center Official Close
N – Next Day Trade (Next Day Clearing)
O – Market Center Opening Trade
P – Prior Reference Price
Q – Market Center Official Open
R – Seller
T – Extended Hours Trade
U – Extended Hours Sold (Out Of Sequence)
V – Contingent Trade
X – Cross Trade
Z – Sold (Out Of Sequence)
4 – Derivatively Priced
5 – Market Center Reopening Trade
6 – Market Center Closing Trade
7 – Qualified Contingent Trade
8 – Reserved
9 – Corrected Consolidated Close Price as per Listing Market
Sale Condition Nasdaq - Denotes the sale condition associated with a trade (utp binnary 1.5 page 43)
@ – Regular Sale
A – Acquisition
B – Bunched Trade
C – Cash Sale
D – Distribution
E – Placeholder
F – Intermarket Sweep
G – Bunched Sold Trade
H – Price Variation Trade
I – Odd Lot Trade
K – Rule 155 Trade (AMEX)
L – Sold Last
M – Market Center Official Close
N – Next Day
O – Opening Prints
P – Prior Reference Price
Q – Market Center Official Open3
R – Seller
S – Split Trade
T – Form T
U – Extended trading hours (Sold Out of Sequence)
V – Contingent Trade
W – Average Price Trade
X – Cross Trade
Y – Yellow Flag Regular Trade
Z – Sold (out of sequence)
1 – Stopped Stock (Regular Trade)
4 – Derivatively priced
5 – Re-Opening Prints
6 – Closing Prints
7 – Qualified Contingent Trade
8 – Placeholder For 611 Exempt
9 – Corrected Consolidated Close (per listing market)
Futures Contract Roll
If one of the symbols selected is a futures contract and and either the ‘Nearest’ or ‘Continue’ aggregations have been selected, a new menu will display allowing you to select the futures roll method.
...