...
Template | Description | Download | Preview | ||||
|---|---|---|---|---|---|---|---|
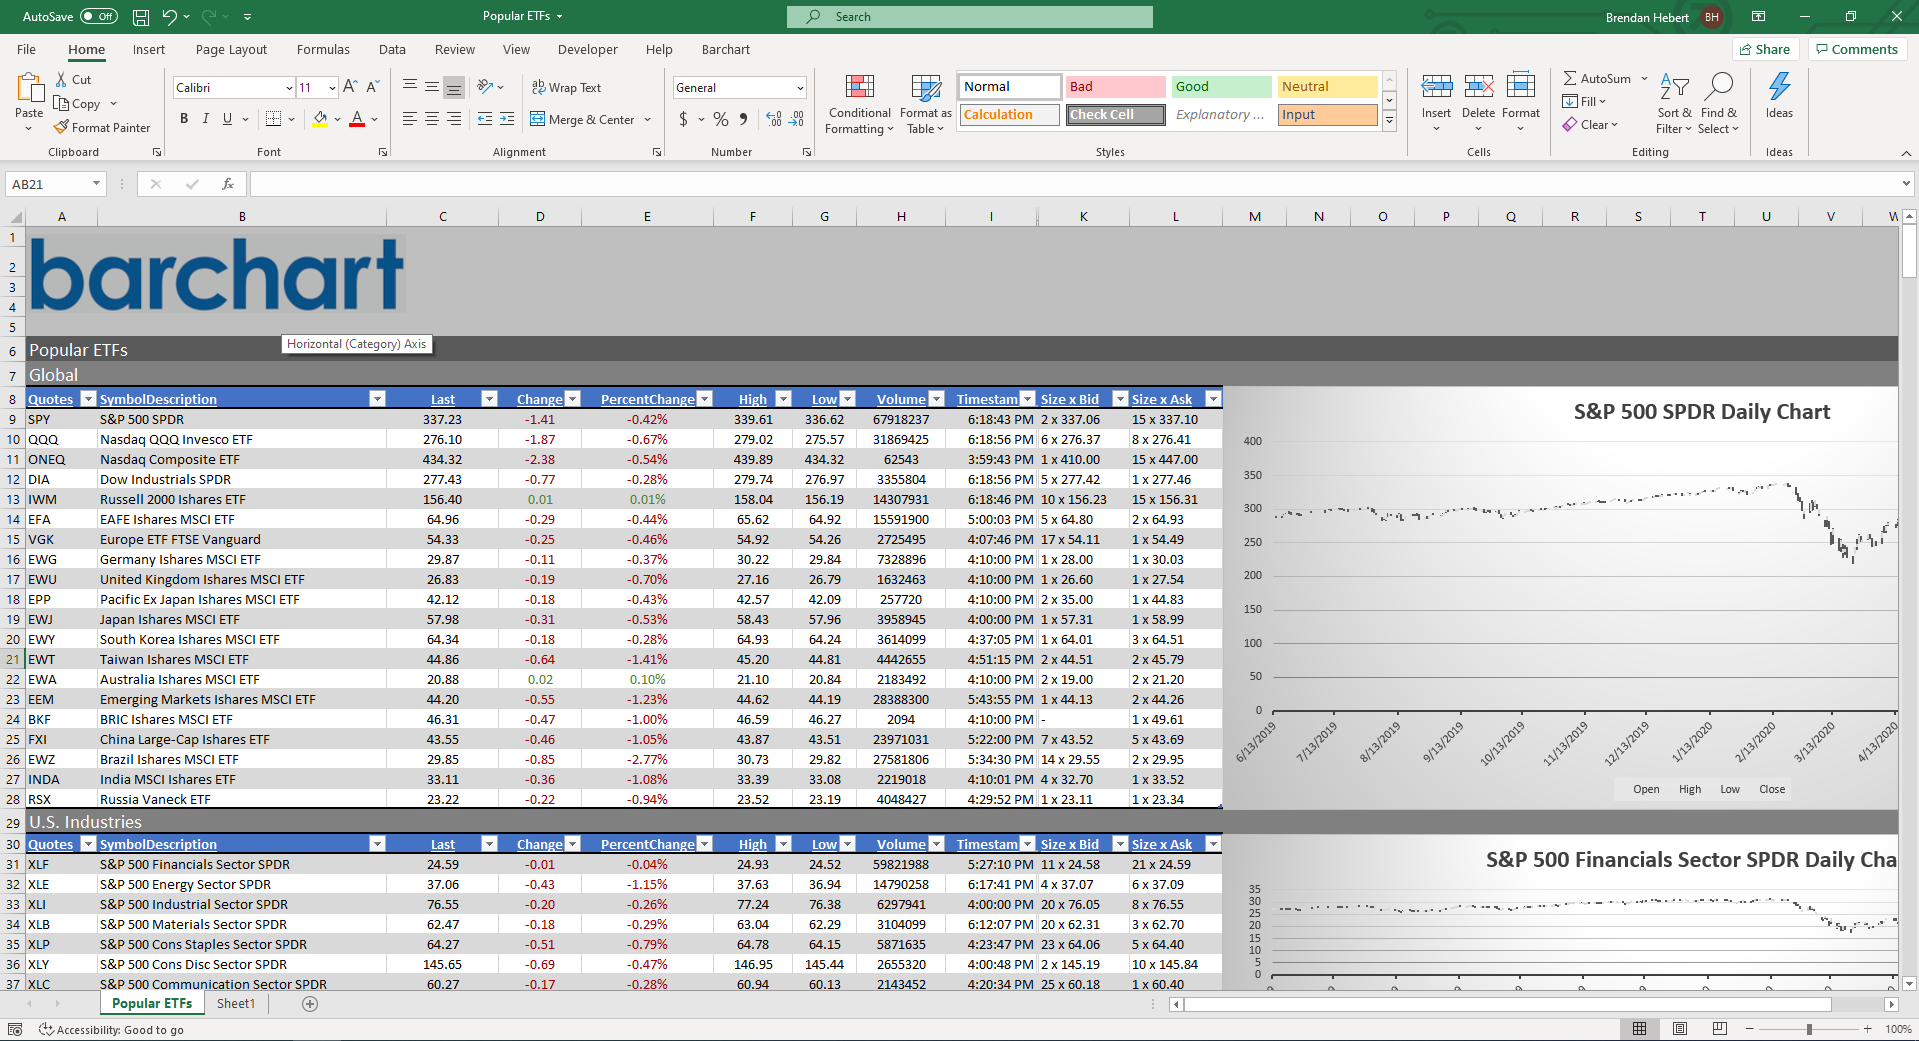
Popular ETFs | The Major ETFs sheet allows you to view worldwide ETFs, hand-picked by the Barchart.com ETF Research Analysts. Analyze each ETF in the broad global sectors and gain a quick look at how these ETFs are performing against one another. Groupings include Global, U.S. Industries, Specialty Industries, Commodity Producers, Fixed Income, Commodities, and Currencies. |
|  | ||||
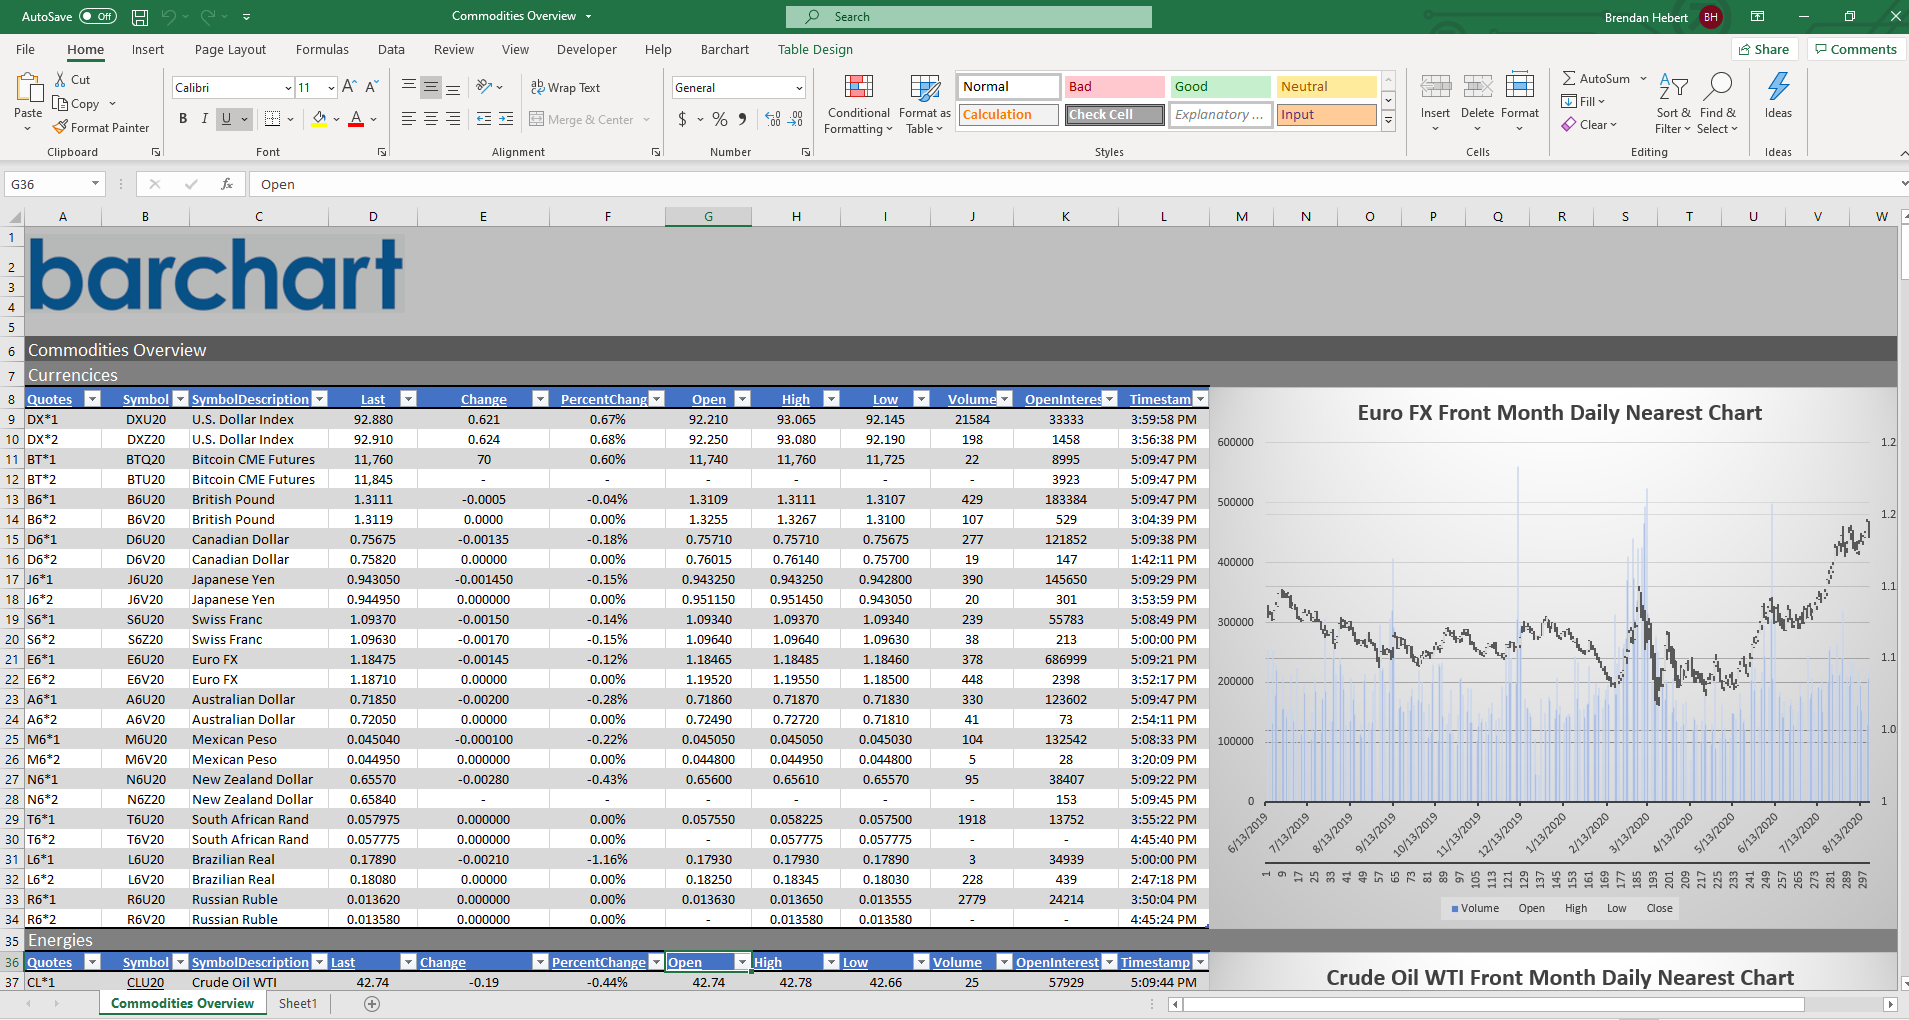
Commodities Overview | The Futures Commodity Groupings lists the lead contracts of the major North American futures markets. |
|  | ||||
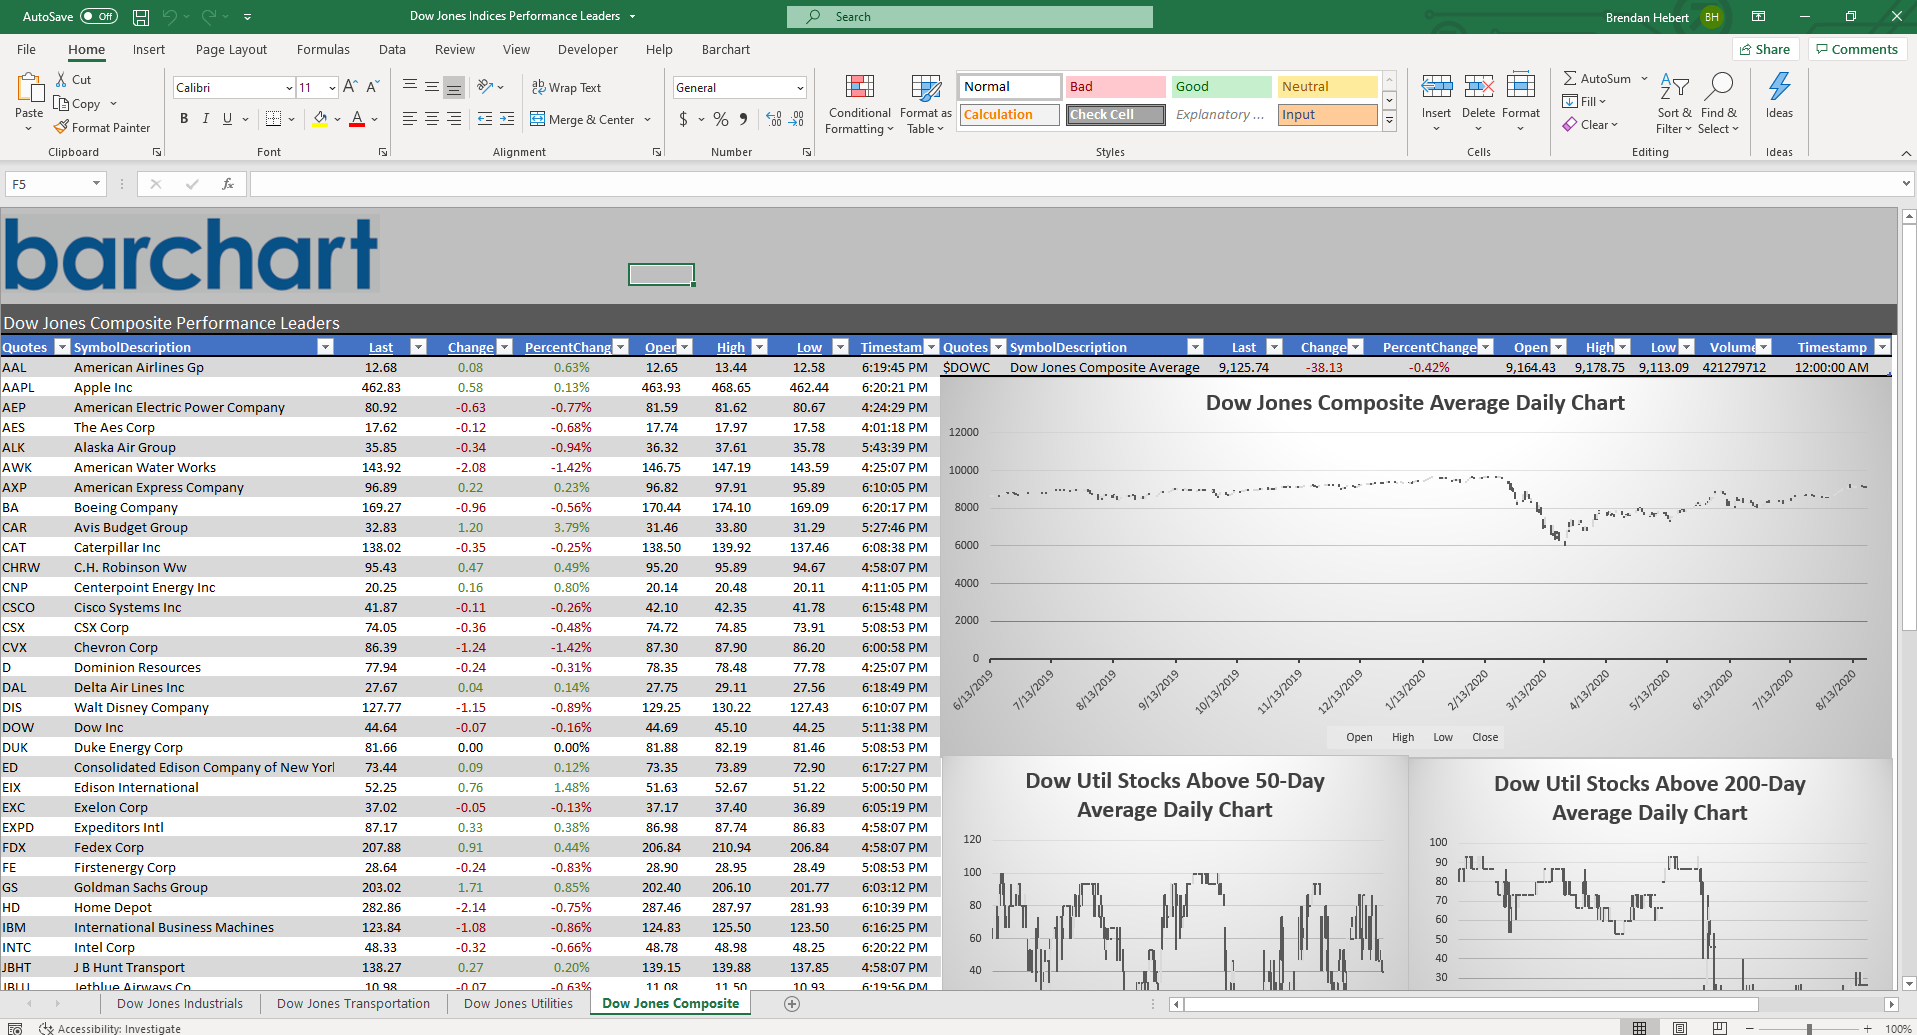
Dow Jones Indices | View all the major Dow indices and their constituents in addition to charts covering the indexes and percentage of components trading over various moving averages. |
|  | ||||
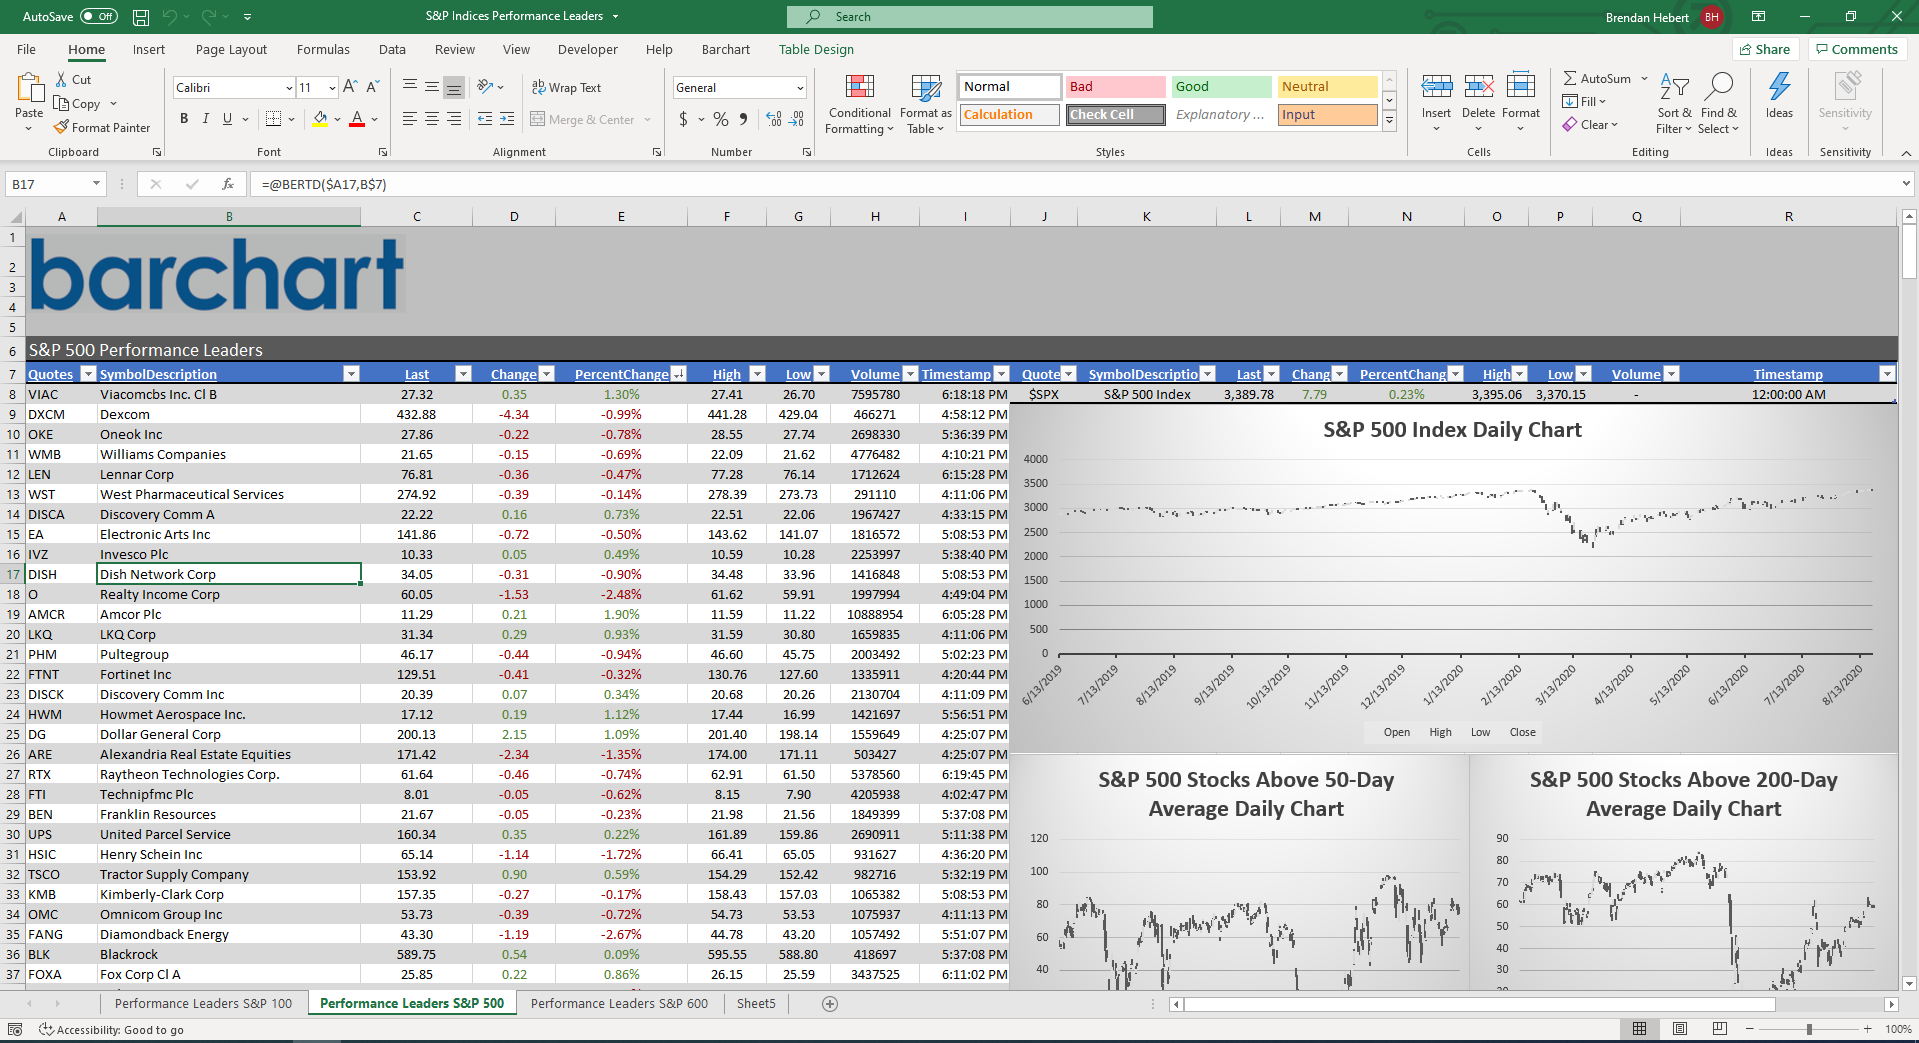
S&P Indices | View all the major S&P indices and their constituents in addition to charts covering the indexes and percentage of components trading over various moving averages. |
|  | ||||
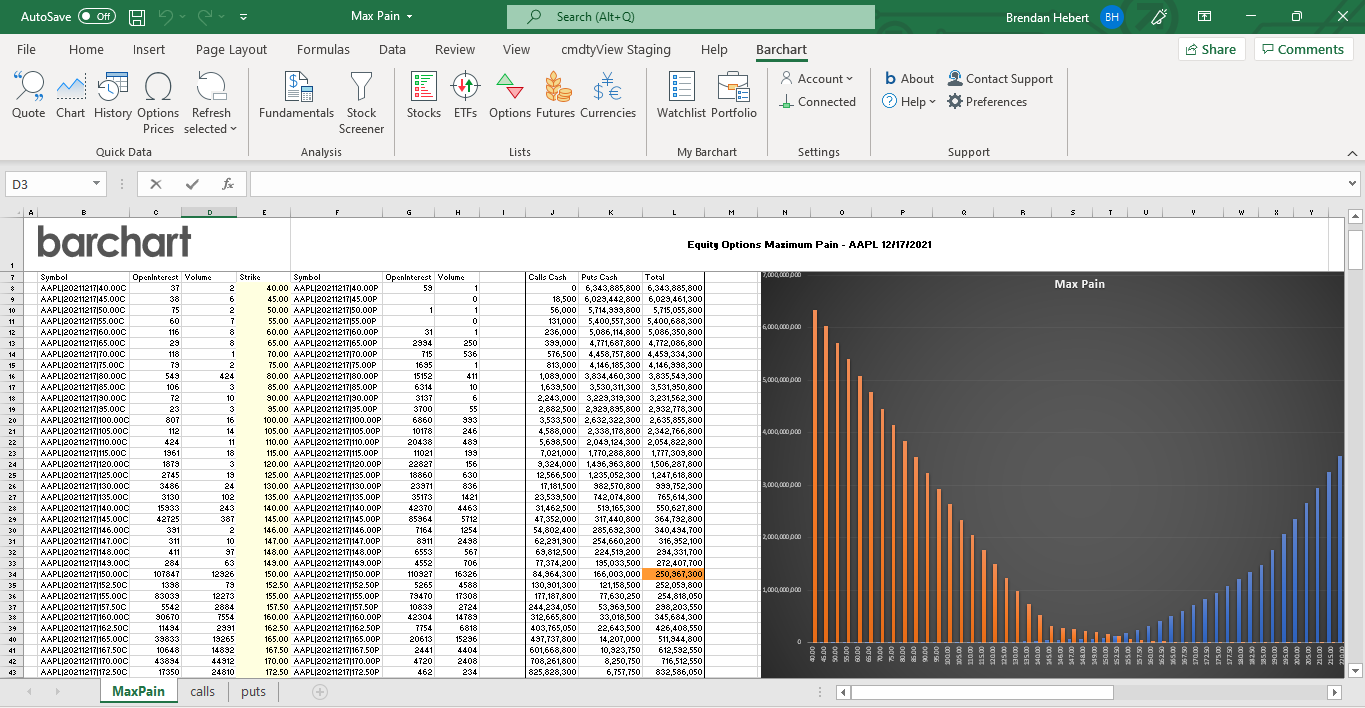
Max Pain | Use the Max Pain template to find the strike at which equity option holders (both calls and puts) stand to loose the greatest while option writers reap the highest capital return. |
|  | ||||
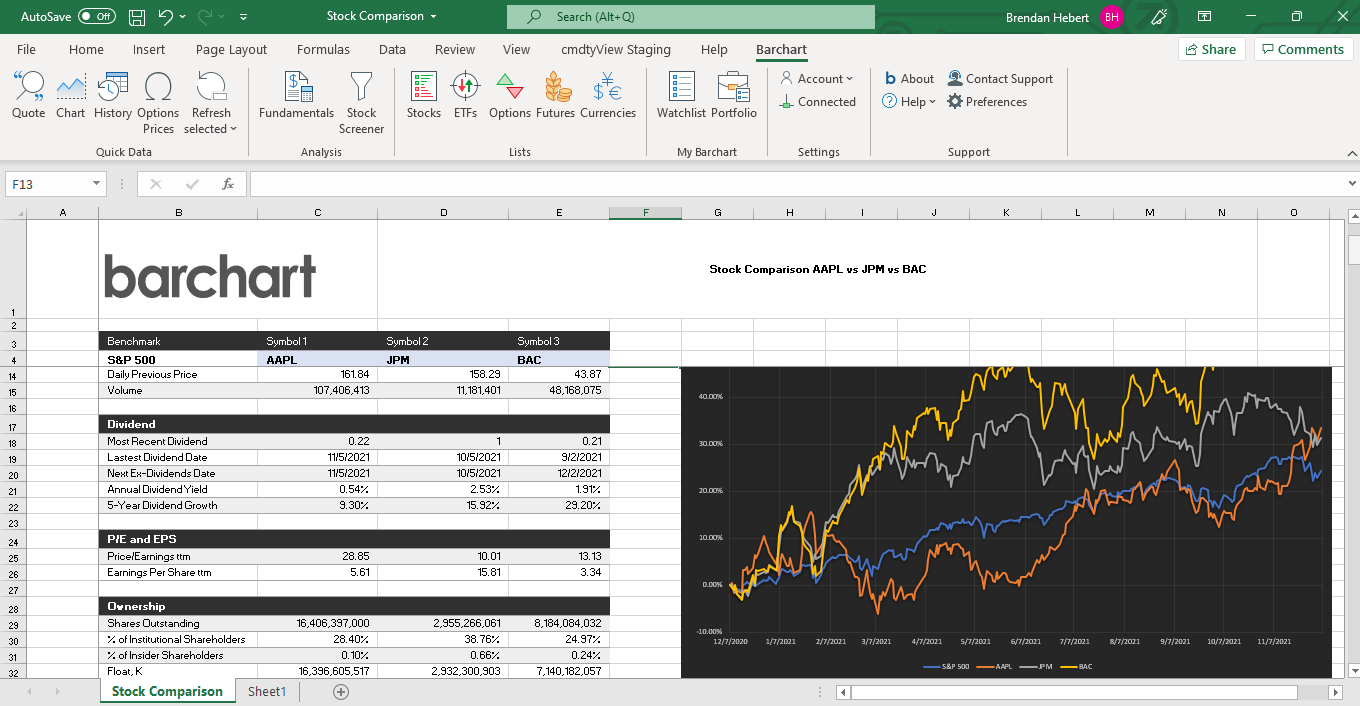
Multiple Stock Comparison | Compare up to three different stocks using price, return, fundamental and financial ratio data. Change any of the tickers and the sheet will dynamically update with the underlying’s data. |
|  | ||||
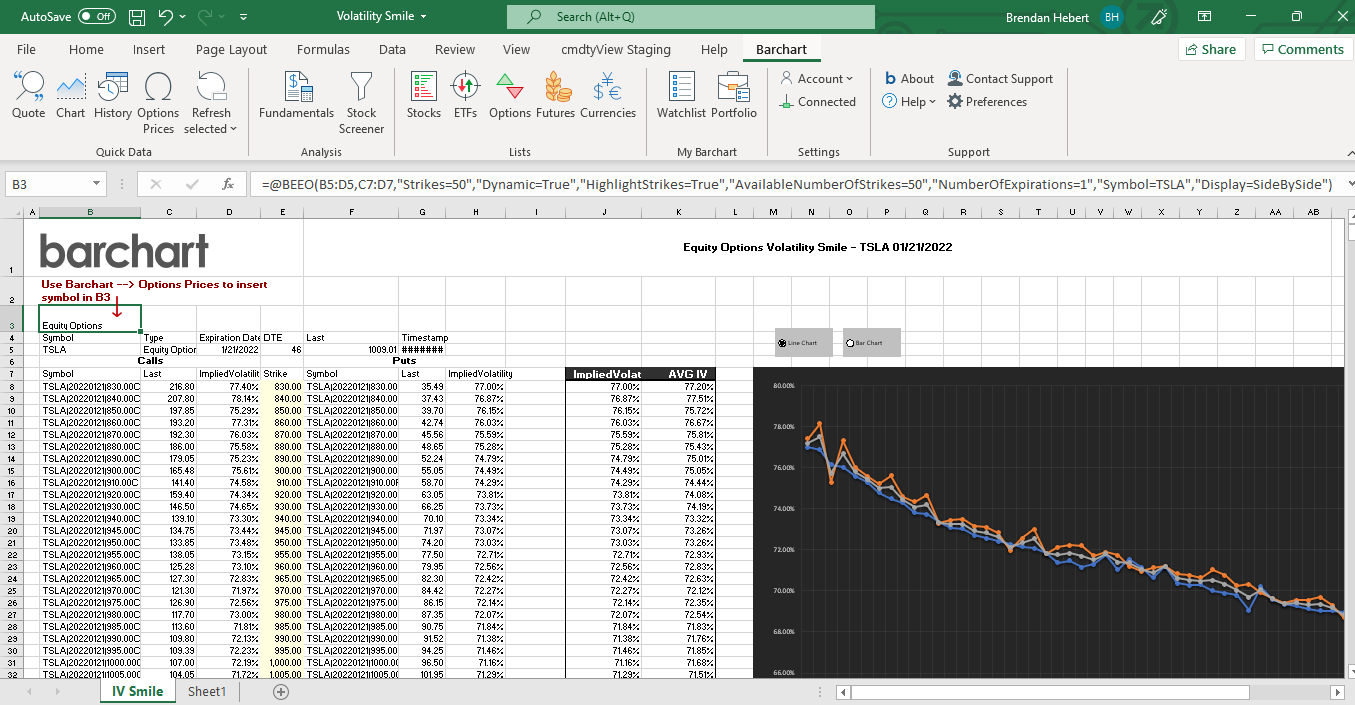
Option Implied Volatility Smile | Chart the equity option smile (skew) for any underlying that has listed options. Update the ticker symbol, expiration, number of strikes and select the style of chart (bar or line) to customize the data displayed. |
|  | ||||
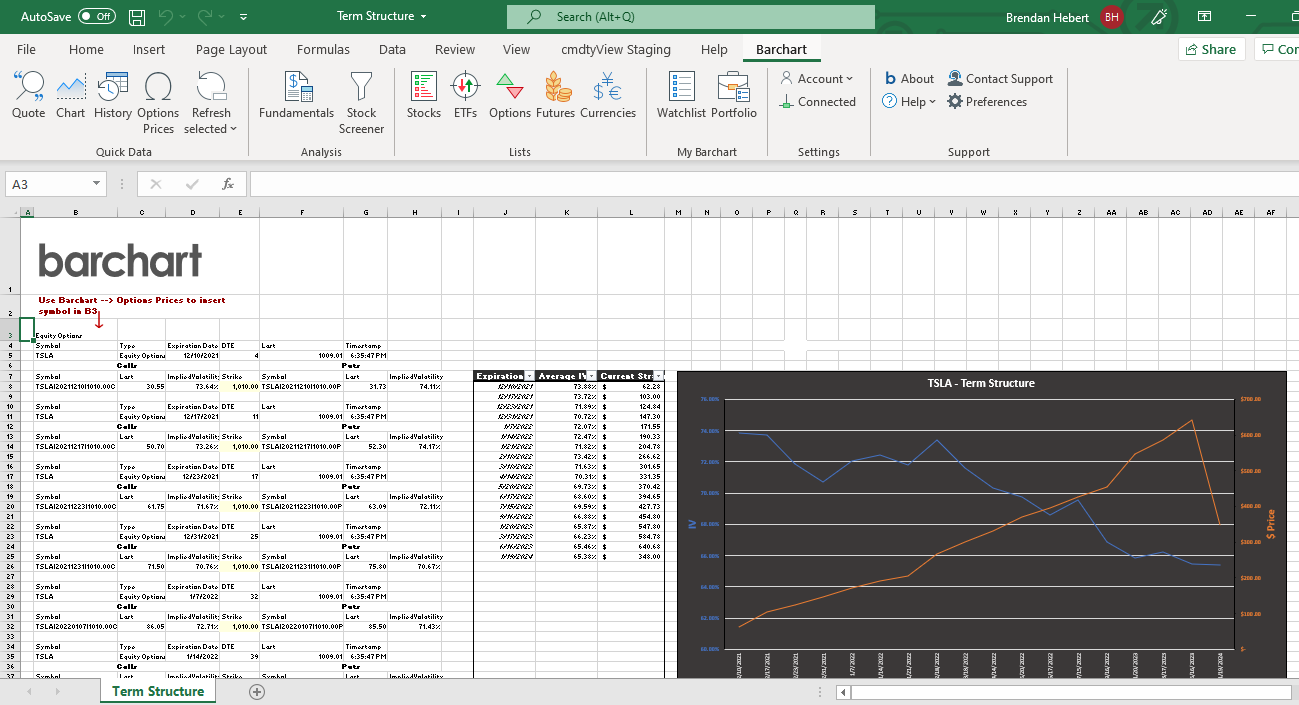
Option Term Structure | Plot the at the money (ATM) implied volatility of monthly, weekly or all expirations against the current ATM straddle price using the Option Term Structure template. Scan for upward or downward sloping term structure to assist in finding the best option maturity to trade. |
|  | ||||
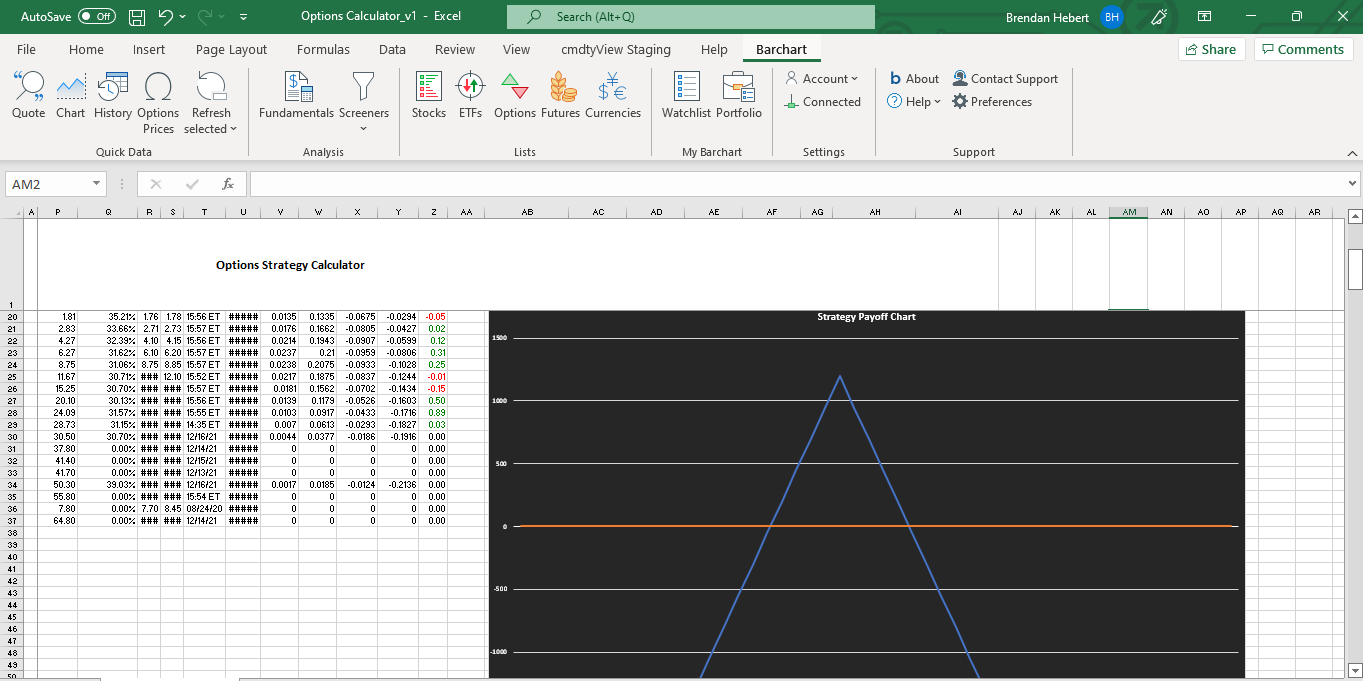
Options Strategy Builder | Input underlying price, lot sizes, strikes and position to view the strategy’s cost, max profit and loss, risk reward ratio, net delta, break even levels and % change to the BE prices. Click on the refresh price to pull in the latest available price. |
|  | ||||
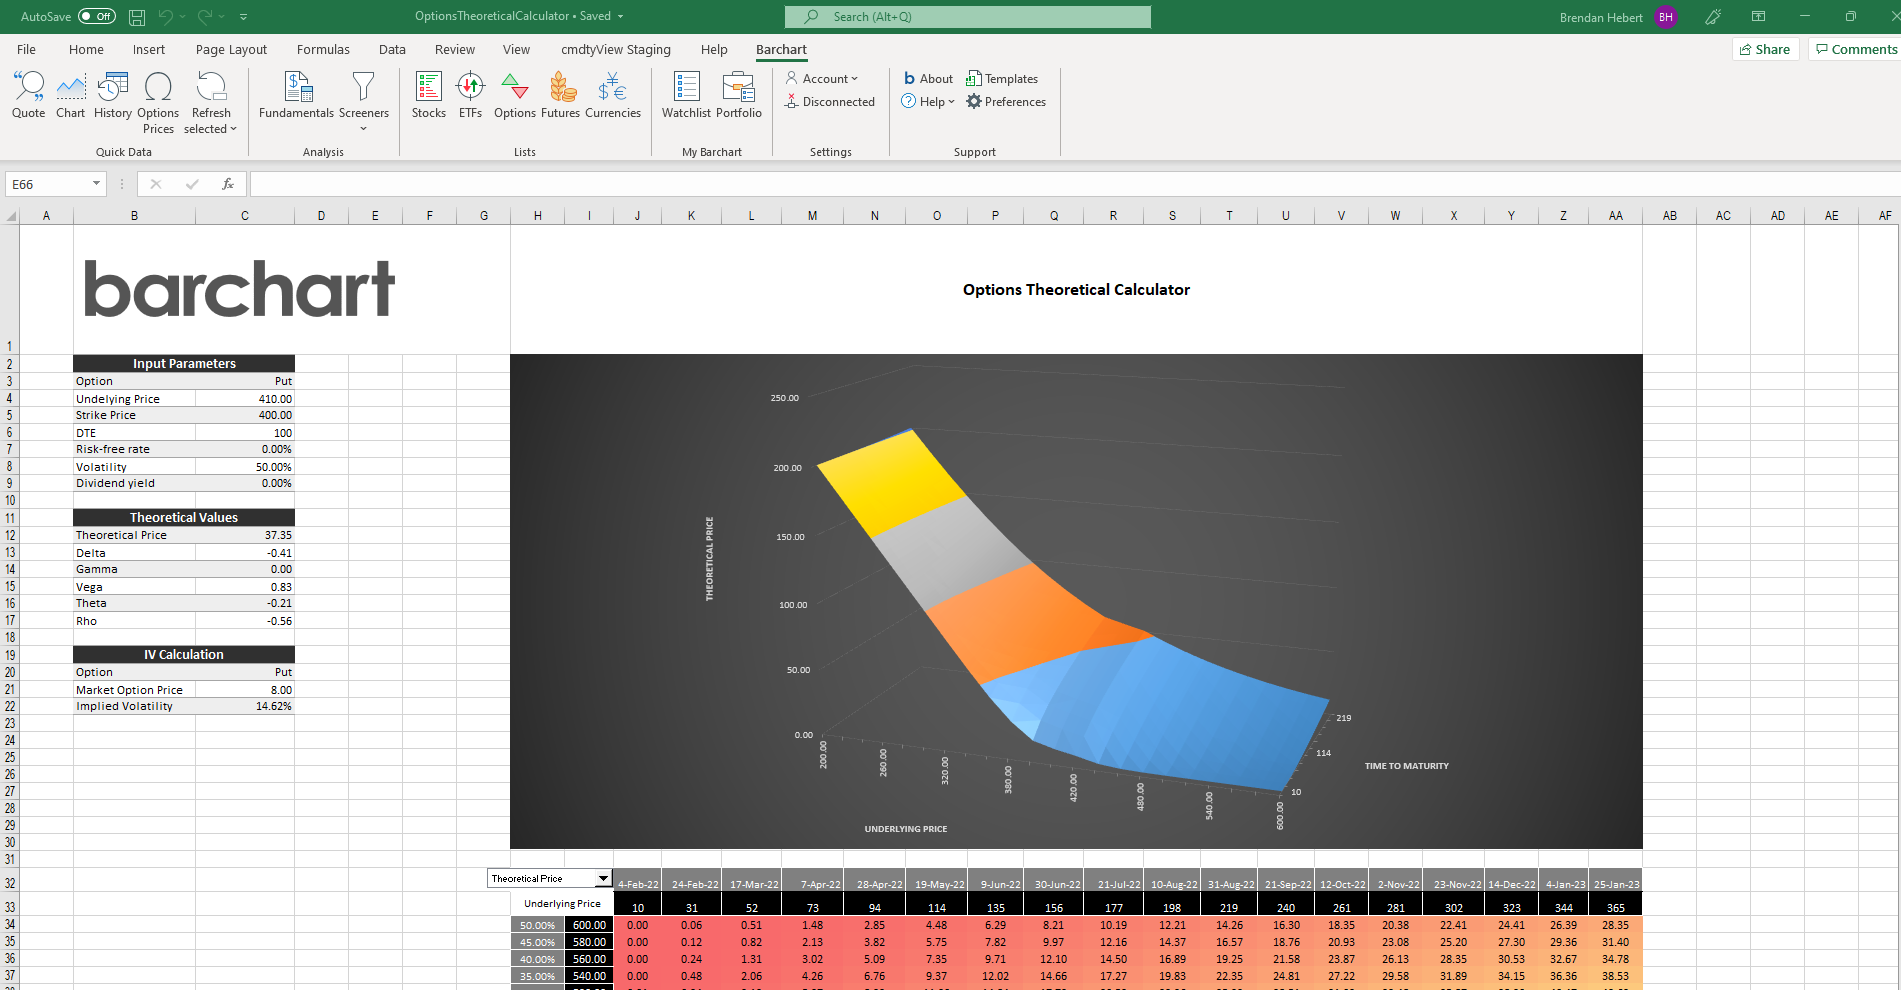
Options Theoretical Calculator | Calculate an option’s theoretical price, delta, gamma, vega, theta and rho using the options theoretical calculator template. Once input parameters are set, plot any of the values against an underlying price and time to maturity. |
|  | ||||
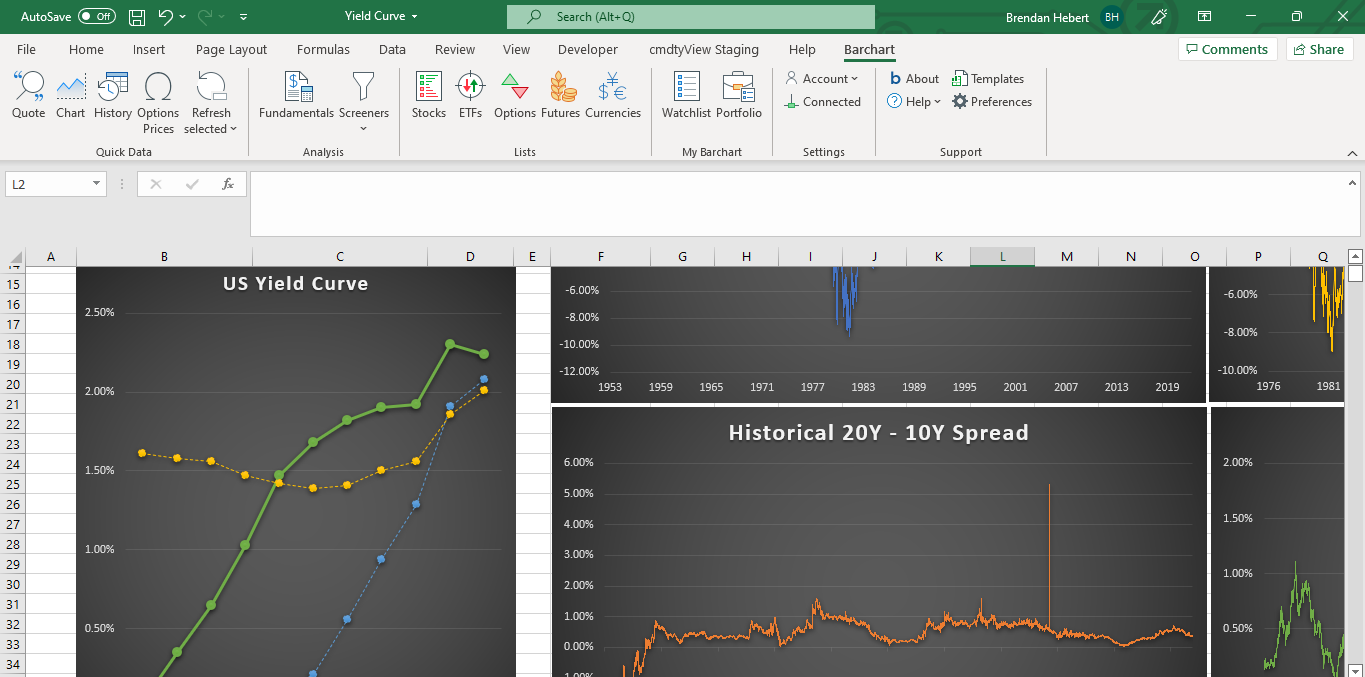
US Treasury Yield Curve | Use the US Treasury Yield Curve template to visualize bond yields and their respective maturities today versus this time last year and two years ago. Analyze yield spreads like the 10Y - 2Y to see if the yield curve is steepening, flattening or potentially inverting. |
|  | ||||
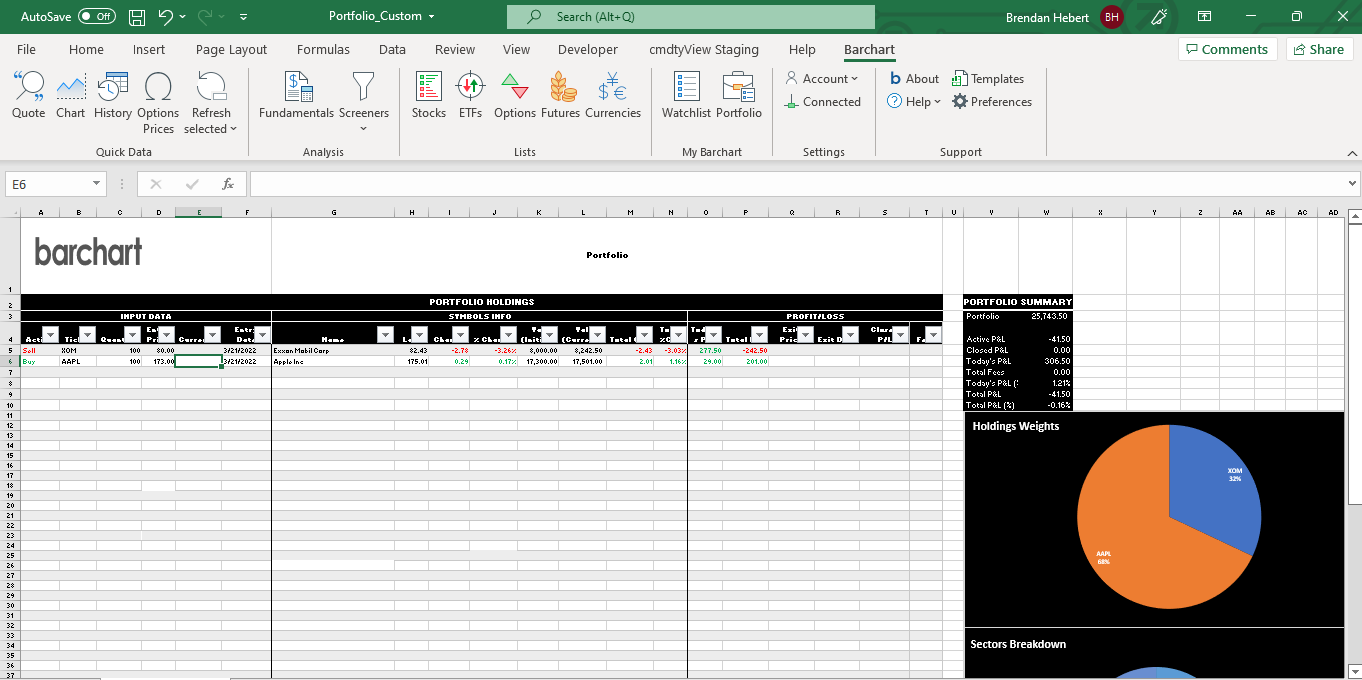
Portfolio | Use the Portfolio template to track buy/sell transactions of your investments and calculate a profit or loss. Enter in the Input Variables and the template will automatically populate the ‘Portfolio Holdings, Profit/Loss, and Portfolio Summary data fields. View the investments visually by holding weights, sectors breakdown and market cap breakdown. |
|  |